This chart shows the EUR/USD on the H1 timeframe, analyzed with the Smart Money Concept (SMC) framework. Below is a detailed market structure breakdown and a potential trading setup:
1. Market Structure
- In early August, the market printed a downside BOS around the 1.1600 zone.
- Since then, multiple upside BOS events have occurred, confirming a shift into a higher high – higher low structure.
- The most recent BOS happened above 1.1780, which now serves as a key pivot.
2. Order Blocks (OB)
- Bullish Order Block: A clear institutional demand zone sits at 1.1720 – 1.1745, where price previously reacted strongly.
- Bearish Order Block: A supply zone can be identified at 1.1860 – 1.1885, aligned with prior liquidity grabs.
3. Liquidity & Fair Value Gap (FVG)
- Liquidity Sweep: Stop-hunt activity took place above 1.1850, followed by a sharp rejection.
- Fair Value Gap: An imbalance lies between 1.1760 – 1.1780, likely to attract a retest.
4. Key Levels
- Support: 1.1720 – 1.1745
- Mid-zone (potential entry area): 1.1760 – 1.1780
- Resistance: 1.1860 – 1.1885
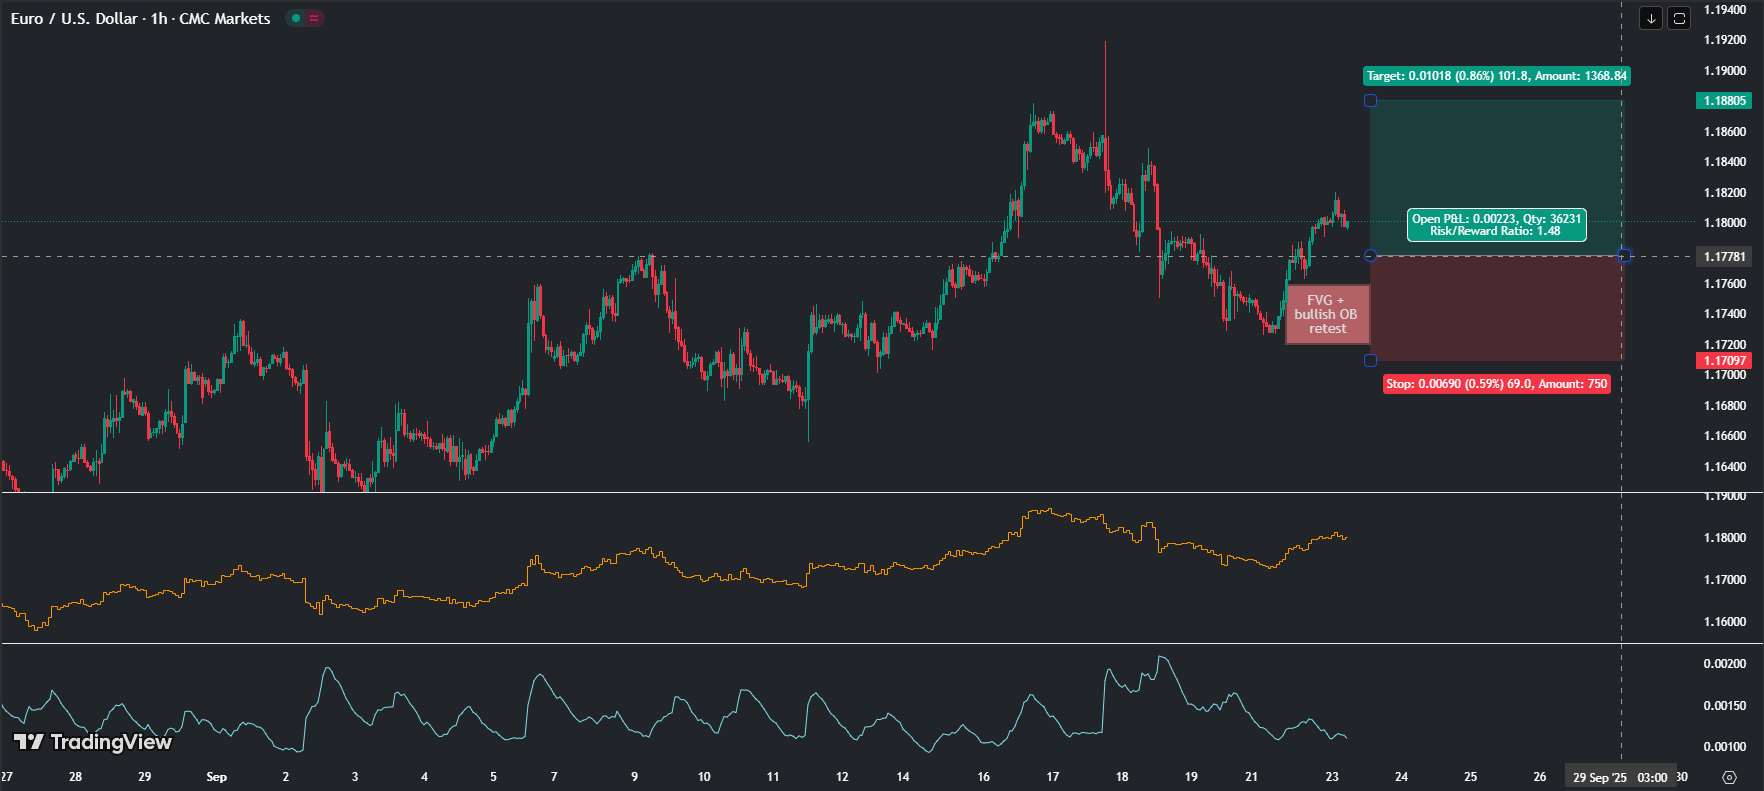
5. Precise Trade Setup (Based on SMC)
- Entry (Buy Limit): 1.1765 – 1.1775 (FVG + bullish OB retest)
- Stop Loss (SL): 1.1710 (below demand zone)
- Take Profit (TP):
- TP1: 1.1830 (short-term target, ~65 pips)
- TP2: 1.1860 (major liquidity zone, ~90 pips)
- TP3: 1.1880 – 1.1890 (bearish OB zone, ~115 pips)
⚖ Risk/Reward Ratio (RRR): Approximately 1:3 – 1:4, depending on exit strategy.
✅ Conclusion:
The EUR/USD is currently displaying clear institutional footprints with strong liquidity sweeps and well-defined order blocks. The most tactical approach is to monitor the 1.1760 – 1.1780 zone for long entries, with liquidity targets at 1.1860 – 1.1885.