.png)
In technical analysis, divergence is a powerful tool that identifies discrepancies between price action and the readings of an indicator. It can also be understood as a comparison between any two graphical plots. Divergences can provide an early warning that momentum is weakening or signal a likely continuation of the current trend.
A Quote from Judy MacKeegen: Regular divergence... Hidden divergence... "What a wonderful tool, it really works!.." or "I see divergence everywhere, and if I traded every signal, I would have been bankrupt long ago. It just doesn't work for me!.." One can often hear such conflicting opinions from traders. In this article, we will attempt to clarify some confusing aspects related to divergence. We hope that after reading this, you will be able to successfully add Regular and Hidden Divergence to your technical trading arsenal.
When trading divergence, indicators such as the Stochastic, MACD, RSI, and many others can be utilized. Divergence signals that form on higher timeframes typically point to more significant price movements.
Regular Divergence (RD)
Regular Divergence (RD) performs best when previous highs or lows in the price are being tested. Many traders interpret this scenario as the formation of a double or triple top/bottom. A strong Regular Divergence occurs during an uptrend when the price forms 3 or 4 higher highs while the indicator simultaneously forms 3 or 4 lower highs. Conversely, during a downtrend, it occurs when the price forms 3 or 4 lower lows while the indicator forms 3 or 4 higher lows. This is referred to as a triple or quadruple Regular Divergence.
Such a divergence signals that the current trend is losing momentum and suggests a potential for a reversal. Some traders interpret this as a signal to tighten their stop-orders, while others see it as an opportunity to take profit.
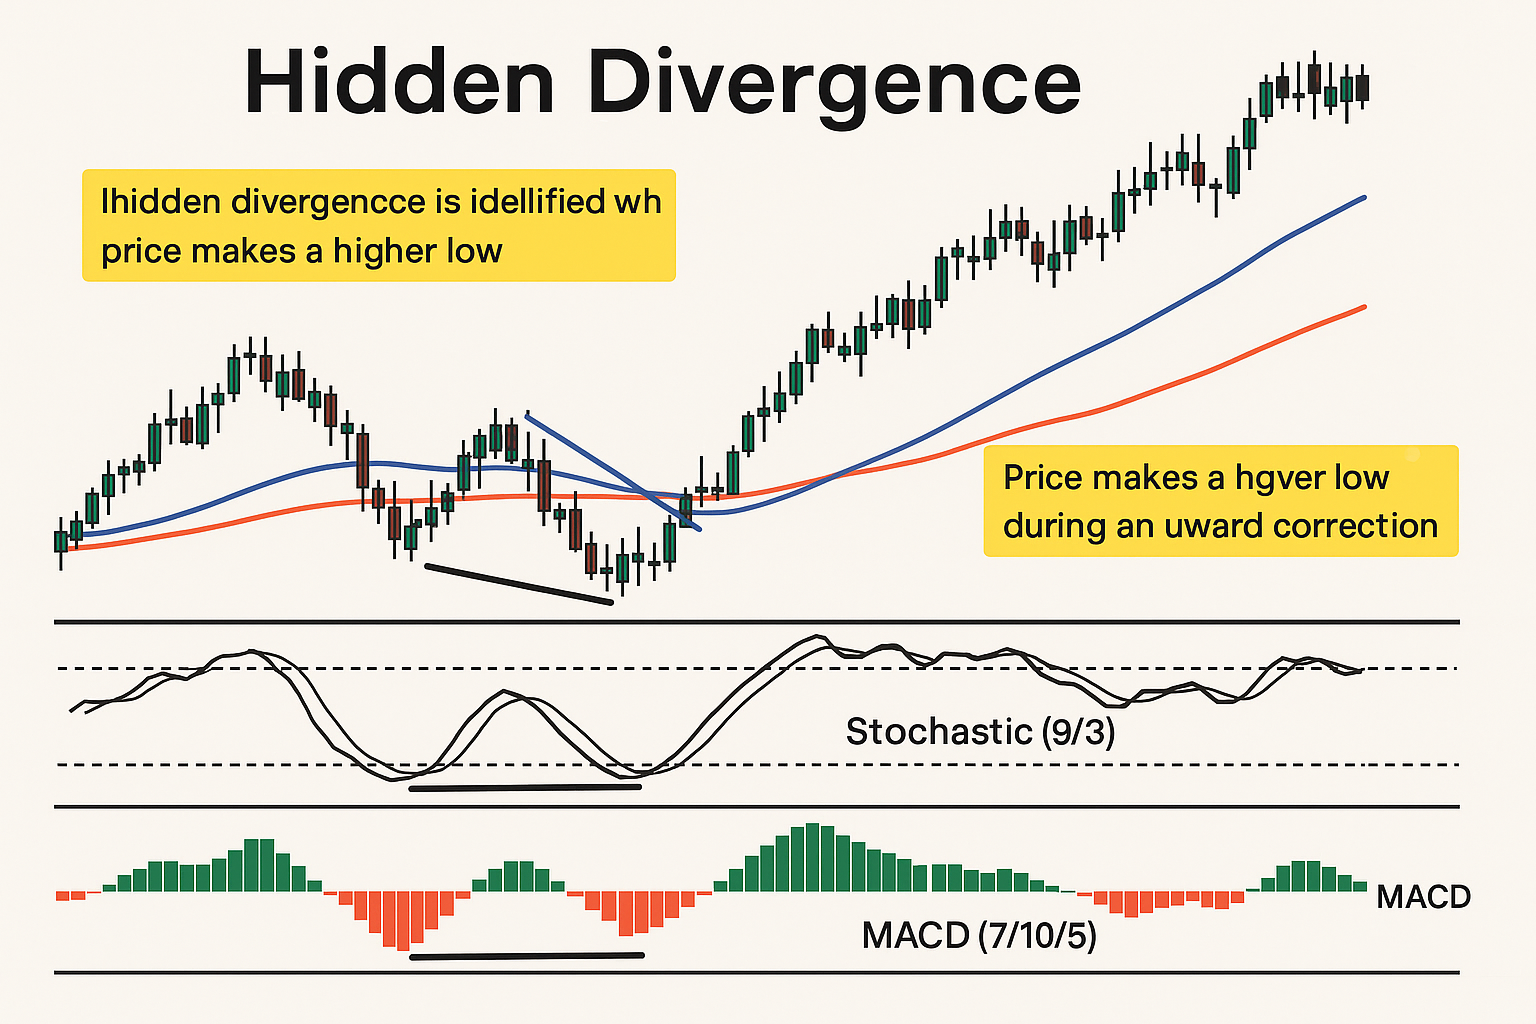
Hidden Divergence (HD)
Hidden Divergence (HD) is better suited for entering trades in the direction of an established trend. In most cases, the price will move in accordance with the Hidden Divergence signal. As the price action develops towards its last major high or low, it creates an opportunity to calculate the trade's risk/reward ratio. If there isn't sufficient distance between our entry point and the last major high/low, many traders prefer to skip the trade.
It is generally advisable not to act on a Hidden Divergence signal if a Regular Divergence has been observed on the last three highs in an uptrend or the last three lows in a downtrend.
During an uptrend, Hidden Divergence is identified when the price makes a higher low during a correction, while the indicator makes a lower low. During a downtrend, it is identified when the price makes a lower high during a correction, while the indicator makes a higher high. Hidden Divergence helps to determine whether the current trend is likely to continue.
Application of Divergence Signals in Trading and Chart Examples
In the examples below, price action is compared with the Stochastic and MACD indicators. Each chart uses a 50-period Exponential Moving Average (blue), a 200-period EMA (red), a 9/3/3 Stochastic, and a 7/10/5 MACD histogram. Different parameters for the Stochastic and MACD can also effectively show divergence.
Example 1: Combination with Trendlines and MACD
The following chart demonstrates how divergence can be used in conjunction with trendline breaks and the MACD crossing its "0" level. The divergence suggests that the price has enough strength to break the trendline resistance. Note the situation on the higher timeframe. As can be seen, switching to a lower timeframe provided a lower-risk entry opportunity.
The chart shows how a trendline break (blue lines), combined with the MACD indicator crossing the "0" line, signaled two low-risk "long" entries. The second low-risk long entry also features its own Hidden Divergence. It is also important to pay attention to the triple Regular Divergence shown on the higher timeframe (inside the circle).
This chart also displays several other Regular and Hidden Divergences. Trendlines, Fibonacci levels, support and resistance zones, as well as chart patterns, can help confirm divergence signals for more reliable trades. You can take any of the ideas presented here and add them to your own trading system. Traders call this a "trading cocktail."
Example 2: Identifying Trend Resumption with Hidden Divergence
The next chart illustrates how to identify a potential trend resumption based on Hidden Divergence. When drawing a trendline on your indicator, it is good practice to match its length with the corresponding trendline drawn on the price chart. Many traders enter the market after a Hidden Divergence is confirmed and the MACD indicator subsequently crosses its "0" level again.
A market moving in a range also forms divergences as it tests the upper and lower boundaries of that range. The next chart shows the advantage of drawing a trendline as soon as two points are established (red arrows on the left). Every time the price touches this trendline, it should be seen as a potential opportunity for a Hidden Divergence to appear. This chart also shows how a Regular Divergence can signal that a subsequent price move is unlikely to reach the previous low, which is valuable information when trading a Hidden Divergence signal.