.png)
In the world of Smart Money Concepts (SMC) and Inner Circle Trader (ICT) methodology, market structure is the backbone of every analysis. It reveals how price moves, how trends form, and when reversals are likely to occur. Understanding market structure allows traders to read the chart as institutions do — following liquidity and intent, not emotion.
In this guide, we’ll break down what market structure is, how to identify it on your charts, and how it determines your bias for every trading session.
What Is Market Structure?
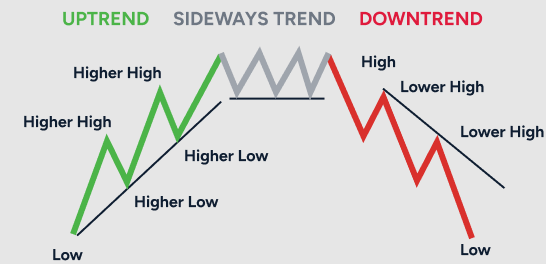
Market structure represents the sequence of swing highs and swing lows that define price direction. It reflects how the market progresses through expansion and retracement phases.
- Bullish Structure: Higher highs (HH) and higher lows (HL) — indicates upward momentum.
- Bearish Structure: Lower highs (LH) and lower lows (LL) — signals downward momentum.
- Consolidation / Range: A period of sideways movement with equal highs and lows, suggesting liquidity accumulation before a major move.
Visual Concept
Institutional traders interpret these swings as liquidity grabs and displacement, not random fluctuations. When a previous swing high is violated with strong volume, it suggests that smart money is engineering liquidity to continue the move or prepare for a reversal.
Structure Shifts and Breaks of Structure (BOS)
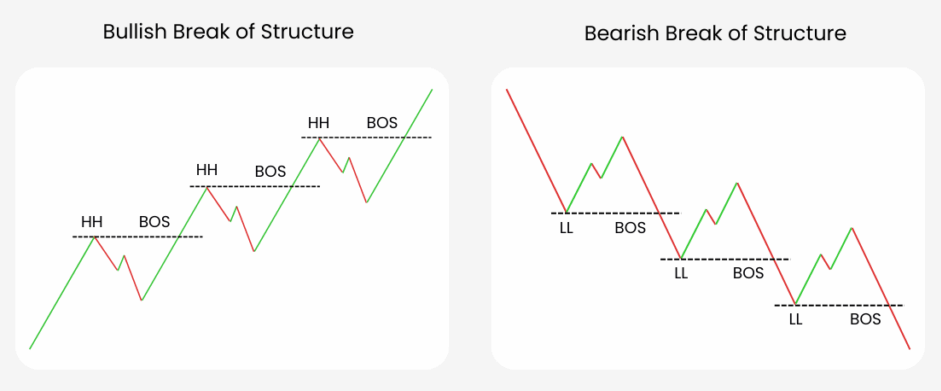
A Break of Structure (BOS) occurs when price closes beyond the previous swing high (in a downtrend) or swing low (in an uptrend). This signals a potential change in directional bias.
For example:
- If price forms lower lows and lower highs, but suddenly breaks above a prior lower high with a strong impulsive candle — it’s a bullish structure shift.
- Conversely, if price has been making higher highs but breaks below a higher low — it indicates potential bearish reversal.
Internal vs External Structure
- External Structure: The overall trend on the higher timeframe (e.g., 4H or Daily).
- Internal Structure: Minor fluctuations or micro-trends within the higher timeframe structure (e.g., M15 or M5).
Successful traders align their entries with both — trading internal structure in the direction of the external trend.
Premium and Discount Zones
Using Fibonacci retracements, we can divide the price range between a swing high and swing low into premium (above 50%) and discount (below 50%) areas:
- Buy at Discount: Look for long setups when price retraces into the lower half of the range.
- Sell at Premium: Look for short setups when price retraces into the upper half.
This concept aligns with institutional behavior: smart money sells when price is expensive (premium) and buys when it’s cheap (discount).
Combining Structure with Liquidity
Institutional traders often manipulate structure to collect liquidity:
- Equal highs attract buy stops above — a target for liquidity grabs.
- Equal lows attract sell stops below — often swept before reversals.
Understanding where liquidity pools exist helps confirm whether a break of structure is genuine or a fakeout.
Example:
- Price forms equal highs.
- A sudden stop-hunt candle wicks above the highs.
- Price reverses sharply and breaks the last low. → This sequence signals bearish intent following liquidity engineering.
How to Use Market Structure in Your Trading Plan
- Define Bias: Identify external structure on higher timeframe (HTF). Are we bullish or bearish overall?
- Wait for Confirmation: Look for structure shifts (BOS or CHoCH) on lower timeframes.
- Refine Entry: Use order blocks, FVGs, or OTE within structure alignment.
- Manage Risk: Place stop losses beyond recent structure highs/lows.
- Track Consistency: Journal structure-based trades to refine precision.
Common Mistakes
- Ignoring the higher timeframe trend.
- Entering before structure confirmation.
- Misinterpreting internal fluctuations as reversals.
- Failing to align liquidity context with structure.
Each mistake weakens the accuracy of your bias — structure should be combined with liquidity and timing (session context) for reliability.
Conclusion
Market structure is not just about drawing swing highs and lows — it’s a story of intent and liquidity. Once you learn to read this story, you start trading with institutional movement, not against it.
Use market structure as your map: it defines bias, confirms reversals, and guides precision entries. Whether you trade SMC, ICT, or simple price action, structure is always the first and most important step.