Risk is the invisible heartbeat of every trading decision. While profits often capture the spotlight, seasoned traders know that long-term success lies in mastering risk management. Understanding how much you can lose, not just how much you can gain, defines the sustainability of your trading career. Three of the most critical risk metrics used by professional traders and portfolio managers are drawdown, risk/reward ratio, and the 1–2% rule. These tools form the backbone of disciplined trading, helping traders protect capital, maintain psychological stability, and build consistent profitability. This article provides a comprehensive exploration of these metrics — their meaning, mathematical foundations, and practical application in both forex and other financial markets.
1. Drawdown: Measuring the Depth of Losses
Drawdown is a measure of decline from a historical peak in your trading account balance or equity. It represents how much of your capital you lose after reaching a high point before recovering again.
In simple terms, drawdown shows how far your equity has fallen from its highest point during a specific trading period.
Formula:
Drawdown (%) = [(Peak Equity − Trough Equity) / Peak Equity] x 100
Where:
- Peak Equity is the highest point of the account before losses begin.
- Trough Equity is the lowest point before recovery.
Example: Suppose your trading account reached $10,000 (peak) and then declined to $8,000 before rising again.
Drawdown (%) = [(10,000 − 8,000) / 10,000] x 100 = 20%
That means you suffered a 20% drawdown from your previous peak.
Types of Drawdown
- Absolute Drawdown - measures how much your equity has dropped below the initial deposit.
Absolute Drawdown = Initial Deposit − Minimum Equity Level
If you started with $5,000 and your lowest point was $4,200:
Absolute Drawdown = 5,000 − 4,200 = 800
- Maximum Drawdown (MDD) - the largest observed decline in your balance or equity over time.
Max Drawdown (%) = max [(Peak−Trough) / Peak] x 100
This metric is used by hedge funds and portfolio managers to evaluate the worst-case performance.
Relative Drawdown - expressed as a percentage relative to the account balance’s peak rather than the initial deposit. Often, this is the metric displayed in trading performance reports.
Interpretation
A smaller drawdown means a more stable trading system. Large drawdowns may indicate high volatility, excessive risk-taking, or emotional decision-making. For example:
- Below 10% → Conservative system
- 10–25% → Moderate risk
- Above 30% → Aggressive and possibly unsustainable
The key is recovery potential. If your account falls by 50%, you must gain 100% to return to breakeven — a daunting challenge.
2. Risk/Reward Ratio: Balancing Potential Gain and Loss
Definition: the risk/reward ratio (R/R) quantifies the relationship between the amount a trader risks on a trade and the expected profit if the trade succeeds.
It answers the question: “How much am I willing to risk for each dollar of potential profit?”
Formula:
Risk / Reward Ratio = [Potential Loss (Risk)] / [Potential Profit (Reward)]
Where:
- Risk = Entry Price − Stop Loss
- Reward = Take Profit − Entry Price
Example: Let’s say you enter a EUR/USD trade:
- Entry: 1.1000
- Stop Loss: 1.0950 (risk = 50 pips)
- Take Profit: 1.1100 (reward = 100 pips)
Then,
R/R = 50 / 100 = 0.5
That means you are risking $1 to potentially gain $2 — a 1:2 ratio.
Interpreting the Ratio
- 1:1 ratio → You risk $1 to make $1 (neutral expectancy).
- 1:2 ratio → You risk $1 to make $2 (favorable).
- 2:1 ratio → You risk $2 to make $1 (unfavorable).
Most professional traders target at least 1:1.5 or 1:2 ratios to maintain positive expectancy even with moderate win rates.
Expected Value (EV) Formula
To quantify whether your strategy is profitable in the long run, use:
Expected Value = (Pwin × Avgwin) − (Ploss × Avgloss)
Where:
- Pwin = Probability of winning
- Ploss = Probability of losing = 1 - Pwin
- Avgwin and Avgloss are average amounts gained or lost per trade.
Example of Expectancy:If:
- Win rate = 45%
- Average win = $200
- Average loss = $100
Then:
EV = (0.45 × 200) − (0.55 × 100) = 90 − 55 = 35
A positive $35 expectancy per trade means your system is statistically profitable despite losing more often than winning — all thanks to a good risk/reward ratio.
R/R in Portfolio Context
For portfolio managers, risk/reward extends beyond individual trades to overall portfolio allocations. They assess how much volatility (risk) a portfolio must endure to achieve a target return. This is often captured by Sharpe Ratio, defined as:
Sharpe Ratio = (Rp − Rf) / σp
Where:
- Rp - Portfolio return
- Rf - Risk-free rate (e.g., Treasury bond)
- σp - Standard deviation of returns (volatility)
A Sharpe Ratio above 1.5 generally indicates efficient risk-adjusted performance.
The 1–2% Rule: Capital Preservation Principle
The 1–2% rule is a fundamental money management guideline stating that you should never risk more than 1–2% of your total trading capital on a single trade.
The rule protects your account from catastrophic loss and ensures you can survive a series of losing trades without emotional or financial ruin.
Formula:
Position Size = [Account Equity × Risk per Trade (%)] / Stop Loss (in $)
Where:
- Account Equity = Total trading capital
- Risk per Trade = Percentage you are willing to risk (e.g., 0.01 for 1%)
- Stop Loss (in $) = Distance between entry and stop-loss in dollar terms per unit.
Example: If:
- Account Equity = $10,000
- Risk = 2% = 0.02
- Stop Loss = 50 pips = $5 per pip
Then:
Position Size = [10,000 × 0.02] / 50 x5 = 200 / 250 = 0.8 lot
Mathematical Justification:
If you risk 2% per trade: After 10 consecutive losses → You still retain 81.7% of your capital.
If you risk 10% per trade: After 10 consecutive losses → You’re left with only 34.9% of your account.
Psychological Advantage
The 1–2% rule reduces emotional pressure. When losses are small and predefined:
- Traders can think clearly and stick to the plan.
- There’s no panic or revenge trading.
- Confidence in the system remains intact.
This is why institutional traders and hedge funds operate under strict risk percentage frameworks, often below 1% for large portfolios.
While 1–2% is a general standard, adaptability matters:
- Beginner traders: Stay at 1% or less to build emotional discipline.
- Intermediate traders: 1.5–2% depending on consistency and win rate.
- Advanced traders: May use dynamic position sizing — risking less in uncertain markets and more when high-probability setups appear.
Integrating All Three Metrics
Assume you have:
- $20,000 account
- You risk 1.5% per trade ($300)
- Stop loss = 50 pips → pip value = $10 → position = 0.6 lots
- Take profit = 150 pips → reward = $1,500
- R/R = 1:5
If the trade wins, your account grows by 7.5%. If it loses, you only lose 1.5% — keeping drawdown low. Even after five losing trades in a row - You still retain 92.7% of your capital — easy to recover from.
Visualizing the Relationship
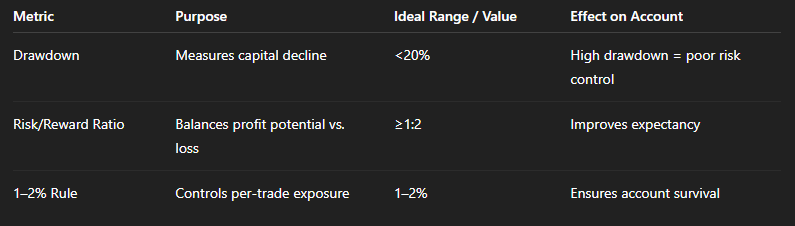
The synergy between these metrics creates mathematical resilience. It transforms trading from speculation into structured risk-taking.
Advanced Insights: Compounding and Drawdown Recovery
With small, consistent percentage gains, your capital grows exponentially due to compounding:
Future Equity =Initial Equity × (1+r) n
Where:
- r = average return per trade or period
- n = number of trades or periods
For example, 2% profit per trade over 50 trades:
Future Equity = 10,000 × (1.02 )50 = 26,870
That’s a 168.7% total return with controlled risk — far better than volatile 20–30% drawdowns that may destroy an account.
Drawdown Recovery Strategy
After a 20% drawdown, focus not on earning 20% back but on adjusting risk:
- Reduce position size by 50%.
- Increase R/R target slightly.
- Avoid revenge trading; focus on A+ setups only.
This approach minimizes further losses and gradually recovers capital while maintaining psychological stability.
Conclusion
Professional trading isn’t about predicting the market — it’s about surviving it. The triumvirate of Drawdown, Risk/Reward Ratio, and the 1–2% Rule forms the foundation of that survival.
- Drawdown teaches humility — it reveals the cost of overconfidence.
- Risk/Reward Ratio brings logic — it quantifies opportunity against danger.
- The 1–2% Rule builds discipline — it enforces capital longevity and mental balance.
A trader who masters these three metrics transitions from emotional decision-making to statistical precision, transforming volatility into structured opportunity. Ultimately, consistent success in trading is less about how much you make and more about how well you protect what you have. Risk management is not a safety net — it is the bridge that leads to long-term financial independence.